8 APAC Assets That Went Global The Out-Licensing Class of 2025 to 2026
29 July 2026 | Wednesday | Analysis
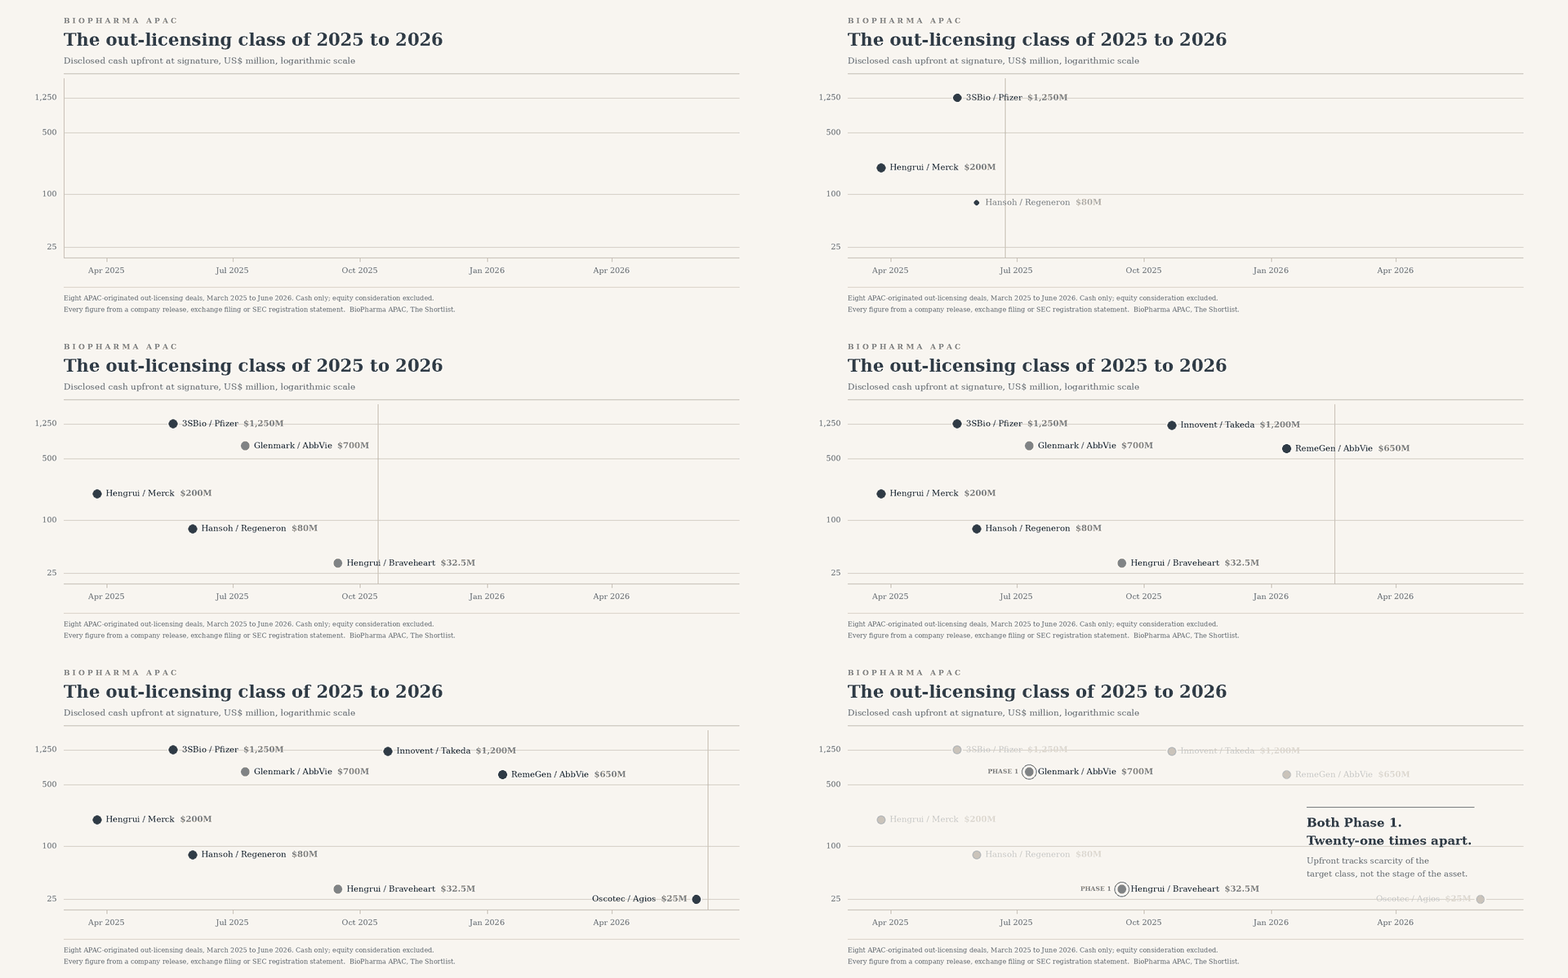
Business development teams across the region keep arriving at the same question, phrased slightly differently each time. What did a comparable asset, at a comparable stage, in a comparable target class, actually fetch?
It is a reasonable question and a surprisingly awkward one to answer, because the evidence is scattered. Some of these deals were announced by the licensee in a US press release. Some were disclosed by the licensor to the Hong Kong exchange. One is legible in full only because the counterparty later filed a registration statement with the Securities and Exchange Commission and had to state, in accounting language, what it had actually paid. Three currencies are involved, at least four disclosure conventions, and a persistent gap between the number that made the headline and the number that made the filing.
This piece does one thing. It puts eight of them in a single table, with the terms as recorded, and then reads what that table says. It is not a verdict on whether the region is being underpaid, overpaid or correctly priced. That argument exists elsewhere and it is worth having. This is the comparables sheet you would want open while you were having it.
How to read this roster
Four tests decided inclusion.
First, the originator had to be headquartered in the Asia-Pacific region at the time of signature. That is a test of where the asset came from, not where the counterparty sits, and it produces one entry whose corporate structure needs a footnote, which we have given it.
Second, the asset had to carry at least Phase 1 clinical data at signature. Platform deals, target-class collaborations and preclinical option packages are out, however large the headline. This removed several of the biggest transactions of the period, which we list at the end rather than quietly omit.
Third, the upfront had to be disclosed. Not estimated, not inferred from a pre-tax charge, not reconstructed from a movement in a receivables line. Where an upfront was folded into a phrase such as “upfront and near-term milestone payments,” we went to the filing and separated the components.
Fourth, the disclosure had to be traceable to a primary document carrying a date. Entries run chronologically by signature or announcement, not by size. Nothing here is ranked, and the order carries no judgement about quality.
Two conventions are worth stating before the table. Upfront means cash paid at or shortly after closing, and it excludes equity even where the announcement bundles the two together, because an equity subscription at a premium is a different instrument from a licence fee and behaves differently on the licensor’s balance sheet. Total value means the maximum contingent sum the licensor could receive if every development, regulatory and commercial milestone lands, which in practice almost none of them will. Milestone totals are a ceiling, not a forecast, and the industry’s habit of leading with them is the single largest source of confusion in this dataset. Royalty ranges are reported where disclosed and marked undisclosed where not. Nothing has been inferred from comparable transactions.
The Eight
1. Hengrui Pharma to Merck, March 2025
Asset and modality: HRS-5346, an oral small molecule inhibitor of lipoprotein(a) formation.
Stage at signature: Phase 2 clinical trial in China.
Upfront: US$200 million in cash.
Total: Up to US$1.77 billion in development, regulatory and commercial milestones.
Territory: Worldwide, excluding the Greater China region.
Royalties: Payable on net sales; rate not specified.
Disclosure: Joint release, Merck and Jiangsu Hengrui Pharmaceuticals, 25 March 2025.
This is the cleanest structure in the roster and a useful baseline for everything that follows. One small molecule, one indication family, one territory carve-out, no equity, no co-development, no option ladder. Merck took ex-Greater China rights and full development responsibility. Hengrui kept the home market outright.
The therapeutic area is the interesting part. Cardiovascular risk reduction was not the modality driving the period’s headline numbers, and the terms reflect that: an upfront worth roughly a tenth of the headline total, comfortably inside the pack. Merck disclosed that it expected to record a US$200 million pre-tax charge on closing, which is the useful cross-check. When a licensee books an upfront as a charge in a named quarter, the cash figure stops being a matter of interpretation.
2. 3SBio to Pfizer, May 2025
Asset and modality: SSGJ-707, a bispecific antibody targeting PD-1 and VEGF, built on the CLF2 platform.
Stage at signature: Phase 2 data in China across non-small cell lung, metastatic colorectal and gynaecological tumours, with the first Phase 3 planned in China for 2025.
Upfront: US$1.25 billion in cash.
Equity: A separate US$100 million subscription by Pfizer on closing.
Total: Up to US$4.8 billion in development, regulatory and commercial milestones.
Territory: Worldwide, excluding China, with an option for Pfizer to extend the licence into China.
Royalties: Tiered, double digit.
Disclosure: Pfizer release dated 19 May 2025, announced 20 May; completion confirmed 24 July 2025.
The largest single-asset cash upfront in the roster and, on this evidence, the high-water mark for a PD-1 and VEGF bispecific out of the region.
The structural feature worth copying is the China option. Rather than sell the home market or hold it permanently, 3SBio wrote a call on it: Pfizer may extend into China later, on terms not disclosed. That converts the domestic territory from an asset the licensor must defend into an asset it can monetise a second time.
Note also that announcement and closing sit two months apart, with antitrust clearance and a shareholder vote in between. For anyone modelling cash timing, signature date and receipt date are not the same date, and the gap in this cohort runs from weeks to a full quarter.
3. Hansoh Pharma to Regeneron, June 2025
Asset and modality: HS-20094, a dual GLP-1 and GIP receptor agonist.
Stage at signature: Phase 3 in China, with more than 1,000 patients studied.
Upfront: US$80 million in cash.
Total: Up to US$1.93 billion in development, regulatory and sales milestones.
Territory: Worldwide, excluding the Chinese mainland, Hong Kong and Macau.
Royalties: Double digit on global net sales outside the retained territories.
Disclosure: Regeneron and Hansoh releases, 2 June 2025.
This is the entry that breaks the intuition most readers bring to the table. The most clinically advanced asset in the roster carried the second-smallest upfront. A Phase 3 asset, in the largest commercial category in the industry, moved for about four per cent of its own headline total.
The explanation is not that Regeneron negotiated harder. It is that by mid-2025 the incretin field was the most crowded competitive space in biopharma, with two entrenched franchises and a long queue of fast-followers behind them. A differentiated mechanism in a thin field commands a premium. A comparable mechanism in a thick field does not, whatever its phase. Stage tells a buyer about risk. It says nothing about scarcity, and price follows scarcity.
4. Ichnos Glenmark Innovation to AbbVie, July 2025
Asset and modality: ISB 2001, a CD38 by BCMA by CD3 trispecific antibody developed on the BEAT protein platform.
Stage at signature: Phase 1 in relapsed or refractory multiple myeloma.
Upfront: US$700 million in cash, subject to regulatory clearance. Receipt confirmed to the Indian exchanges on 9 September 2025.
Total: Up to US$1.225 billion in development, regulatory and commercial milestones.
Territory: AbbVie takes North America, Europe, Japan and Greater China. The originator retains India, the rest of Asia, South Korea, Australia and New Zealand, Latin America, Russia and the CIS, the Middle East and Africa, and keeps ownership of the BEAT platform.
Royalties: Tiered, double digit.
Disclosure: Joint AbbVie and IGI release, 10 July 2025.
The outlier of the roster in three directions at once, and the reason it belongs in every regional comparables pack.
It is the only entry with an Indian originator. It carries the highest upfront-to-total ratio in the set, roughly 36 per cent, meaning the licensor took more than a third of its maximum contingent value as cash on day one. And its territory map runs the opposite way to every China deal here: the licensee took Greater China and Japan, the two markets a Chinese originator would never sell, while the originator kept India and the wider emerging-market band.
One structural note the roster requires. IGI Therapeutics SA is a subsidiary of Ichnos Glenmark Innovation, headquartered in New York, which is in turn wholly owned by Mumbai-headquartered Glenmark Pharmaceuticals. The asset was developed on a platform Glenmark owns and the proceeds consolidate to an Indian parent, which is why it passes the originator test as we have written it. Readers building league tables by legal domicile will code it differently, and should say so when they do.
5. Hengrui Pharma to Braveheart Bio, September 2025
Asset and modality: HRS-1893, a cardiac myosin inhibitor.
Stage at signature: Phase 1.
Upfront: US$32.5 million in cash, plus 32,500,000 shares of non-voting Series A preferred stock issued at an original price of US$1.00 per share and carried at a fair value of US$0.79 per share, giving total equity consideration of US$25.7 million.
Total: Up to US$23.0 million on technology transfer and development milestones, and up to US$1.0 billion on commercial milestones, aggregating to approximately US$1.02 billion.
Territory: Worldwide, excluding mainland China, Hong Kong, Macau and Taiwan, with a non-exclusive manufacturing licence inside the retained territory for supply into the licensed territory.
Royalties: Tiered, 5 to 10 per cent of total annual net sales, product by product and country by country. The licensor is separately compensated for ongoing programme expenses.
Structure: NewCo. Braveheart Bio was formed to hold the asset and is venture backed.
Disclosure: Braveheart Bio Form DRS and Form S-1 filed with the SEC in 2026, describing the September 2025 exclusive licence agreement.
The most instructive entry in the roster, and the reason is documentary rather than commercial.
At announcement this deal was widely reported as US$75 million in upfront and near-term milestone payments against a total of up to US$1.1 billion. Both are defensible summaries. Neither is what the filing says. The registration statement separates the components: US$32.5 million of cash, US$25.7 million of equity at fair value, and a milestone ladder in which the overwhelming majority of contingent value, a full billion dollars of it, sits behind commercial rather than development gates.
That last point matters more than the cash split. A ladder weighted to commercial thresholds pays only if the product sells. A ladder weighted to development and regulatory gates pays on progress. Two deals with identical headline totals can therefore carry materially different risk-adjusted values, and the headline will not tell you which is which. The Braveheart filing is a rare case where a reader can see the whole ladder, because a company preparing to list has to show it.
The NewCo structure is the other thing to log. The licensor took equity in the vehicle, which means it participates in the vehicle’s eventual value rather than only in the asset’s milestones. That is the trade now being made across a growing share of the region’s early-stage deals: a smaller cash cheque in exchange for a claim on the counterparty itself.
6. Innovent Biologics to Takeda, October 2025
Assets and modality: IBI363, a PD-1 and IL-2 alpha-bias bispecific antibody fusion protein, and IBI343, a Claudin 18.2 directed antibody-drug conjugate, plus an exclusive option over IBI3001, an EGFR and B7H3 bispecific ADC in Phase 1.
Stage at signature: Both lead assets late stage. IBI363 in multiple Phase 2 studies with a global Phase 3 planned in non-small cell lung cancer, on data in more than 1,200 patients. IBI343 in Phase 3 in gastric and gastro-oesophageal junction cancer in China and Japan, with a completed global Phase 1/2 and a completed Phase 2 in pancreatic cancer.
Upfront: US$1.2 billion, inclusive of a US$100 million equity investment made through a new share issue at HK$112.56, a premium of roughly 20 per cent to the market price.
Total: Up to approximately US$10.2 billion in development and sales milestones across the three programmes if the option is exercised, for a headline total of up to US$11.4 billion.
Territory: Worldwide, excluding Greater China. Innovent retains all rights inside Greater China.
Structure: Co-development of IBI363 on a 60/40 cost split in Takeda’s favour; Takeda leads US co-commercialisation with profits and losses shared 40/60 between Innovent and Takeda; Takeda holds exclusive commercialisation outside the United States and Greater China. Royalties payable on the other molecules.
Disclosure: Takeda and Innovent releases, 21 and 22 October 2025; Takeda Form 6-K filed 30 October 2025; closing confirmed 4 December 2025.
The most structurally complex entry and, for that reason, the least useful as a simple comparable. Two late-stage assets, one option, a shared cost line, a shared US profit line and a straight royalty line all sit inside a single headline number.
What it does establish is the ceiling for a multi-asset late-stage package out of the region in this period, and the fact that an Asian licensee is now competing at the top of that market. Takeda is headquartered in Osaka. That detail turns out to matter for how the roster reads as a whole, and we return to it below.
The equity premium is worth logging separately. A subscription priced 20 per cent above market is a signal that costs the buyer real money, which makes it better evidence of conviction than any adjective in the accompanying release.
7. RemeGen to AbbVie, January 2026
Asset and modality: RC148, carried by the licensee as ABBV-1480, a bispecific antibody targeting PD-1 and VEGF.
Stage at signature: Phase 1/2, in development as monotherapy and in combination regimens across multiple advanced solid tumours including certain lung cancers, with initial antitumour activity reported in combination with an antibody-drug conjugate.
Upfront: US$650 million in cash.
Total: Up to US$4.95 billion in aggregate development, regulatory and commercial milestones.
Territory: Worldwide, excluding the Greater China territory.
Royalties: Tiered, double digit on net sales outside Greater China.
Disclosure: AbbVie and RemeGen release, 12 January 2026. Completion, and the US$650 million upfront recorded as acquired IPR&D expense, confirmed in AbbVie’s Form 10-Q for the quarter ended 31 March 2026.
This is the most valuable entry in the roster, because it is not merely another data point. Read against entry two, it is the only true like-for-like comparable the period produced.
RC148 and SSGJ-707 are the same thing: PD-1 and VEGF bispecific antibodies, both out of China, both licensed to large US buyers. Everything a comparables exercise normally has to control for is already held constant. What differs is stage and timing. 3SBio sold a Phase 2 asset in May 2025 for US$1.25 billion in cash. RemeGen sold a Phase 1/2 asset eight months later for US$650 million. Set the two side by side and the earlier asset commanded roughly 1.9 times the upfront at roughly one phase further advanced.
That is the single most defensible read in this dataset, and business development teams should use it in preference to anything else here. Every other pairing in the roster requires an argument about whether the assets are comparable. This one does not.
One caution before it is over-read. Two observations do not establish a rate, and the two deals differ in ways the numbers conceal. AbbVie’s stated rationale is combinability: it intends to run RC148 alongside its own ADC portfolio. An asset that plugs directly into a specific buyer’s pipeline is worth more to that buyer than to the market at large, and that buyer-specific premium will never show up in any stage-based comparable. The wider point stands regardless. In 2022 a Phase 1/2 asset of this origin would not plausibly have cleared nine figures at all.
8. Oscotec to Agios, June 2026
Asset and modality: Cevidoplenib, also carried as SKI-O-703, an oral next-generation spleen tyrosine kinase inhibitor.
Stage at signature: Phase 2 complete in immune thrombocytopenia. The trial missed its primary endpoint of doubling platelet count at 12 weeks; the licensee cited durable platelet responses across secondary endpoints. Phase 3 planned for the first half of 2028.
Upfront: US$25.0 million in cash.
Total: Up to US$140.0 million in development and regulatory milestones across up to three indications in the United States and Europe, plus commercial milestones that were not quantified.
Territory: Exclusive global rights across all indications. Oscotec holds an option to take back exclusive development and commercialisation rights in South Korea following Phase 3 results.
Royalties: High single digit to mid-teen on net sales.
Disclosure: Agios release, 1 June 2026.
The smallest upfront in the roster and the only entry where the asset moved carrying a failed primary endpoint. The price reflects that with unusual honesty. Twenty-five million dollars is a screening fee rather than a conviction bet, and the structure loads almost everything onto later gates.
The Korean option-back deserves attention because it is a third territory template. The originator did not carve out its home market at signature and did not sell it permanently either. It sold everything and bought a call on its home rights, exercisable once the asset is de-risked. For a mid-cap licensor without the balance sheet to run a domestic Phase 3, that is a rational way to hold optionality without paying for it now.
One disclosure note. The deal was widely reported in Korea as worth up to US$665 million. The company release quantifies US$25 million upfront and up to US$140 million in development and regulatory milestones, with commercial milestones and royalties undisclosed. The larger figure is the licensor’s own estimate of full contingent value including the unquantified components. Both numbers were honestly arrived at. They are not the same class of number, and a comparables table that mixes them is worse than useless.
Deal terms at a glance
Eight APAC-originated out-licensing transactions signed between March 2025 and June 2026. Upfront figures are cash unless stated; equity is shown separately. Total, maximum is the sum of the disclosed upfront and the maximum quantified contingent payments, and represents a ceiling that is very unlikely to be reached in full.
|
Originator (HQ) |
Partner |
Asset and modality |
Stage at signature |
Upfront, cash |
Total, maximum |
Territory to partner |
Royalty |
Disclosure |
|
Jiangsu Hengrui Pharmaceuticals (China) |
Merck / MSD |
HRS-5346, oral small molecule Lp(a) inhibitor |
Phase 2 (China) |
US$200M |
US$1.97B |
Worldwide ex-Greater China |
Undisclosed rate |
Joint release, 25 Mar 2025 |
|
3SBio (China) |
Pfizer |
SSGJ-707, PD-1 x VEGF bispecific antibody |
Phase 2 (China); Ph3 planned |
US$1,250M plus US$100M equity |
US$6.05B |
Worldwide ex-China; option into China |
Tiered, double digit |
Pfizer release, 19 May 2025; closed 24 Jul 2025 |
|
Hansoh Pharmaceutical (China) |
Regeneron |
HS-20094, dual GLP-1 / GIP receptor agonist |
Phase 3 (China) |
US$80M |
US$2.01B |
Worldwide ex-mainland China, HK, Macau |
Double digit |
Joint releases, 2 Jun 2025 |
|
Ichnos Glenmark Innovation (India / US) |
AbbVie |
ISB 2001, CD38 x BCMA x CD3 trispecific antibody |
Phase 1 (r/r myeloma) |
US$700M |
US$1.925B |
North America, Europe, Japan, Greater China |
Tiered, double digit |
Joint release, 10 Jul 2025; receipt 9 Sep 2025 |
|
Jiangsu Hengrui Pharmaceuticals (China) |
Braveheart Bio (NewCo) |
HRS-1893, cardiac myosin inhibitor |
Phase 1 |
US$32.5M cash plus equity at US$25.7M fair value |
approx. US$1.06B (equity excluded) |
Worldwide ex-mainland China, HK, Macau, Taiwan |
Tiered, 5 to 10 per cent |
Braveheart Bio Form DRS / S-1, SEC, 2026 |
|
Innovent Biologics (China) |
Takeda |
IBI363 (PD-1 x IL-2a) and IBI343 (CLDN18.2 ADC), plus option on IBI3001 |
Phase 2 and Phase 3 |
US$1,200M incl. US$100M equity |
US$11.4B |
Worldwide ex-Greater China |
Royalties plus US profit share on IBI363 |
Releases 21 to 22 Oct 2025; Form 6-K 30 Oct 2025; closed 4 Dec 2025 |
|
RemeGen (China) |
AbbVie |
RC148 / ABBV-1480, PD-1 x VEGF bispecific antibody |
Phase 1/2 |
US$650M |
US$5.6B |
Worldwide ex-Greater China |
Tiered, double digit |
Joint release, 12 Jan 2026; AbbVie Form 10-Q, Q1 2026 |
|
Oscotec (South Korea) |
Agios Pharmaceuticals |
Cevidoplenib (SKI-O-703), oral SYK inhibitor |
Phase 2 complete (endpoint missed) |
US$25M |
US$165M quantified |
Global, all indications; Korea option-back after Ph3 |
High single digit to mid-teen |
Agios release, 1 Jun 2026 |
Ordered chronologically by announcement or signature date, not by size. Rounding: totals are stated to the precision of the underlying disclosure. Where the licensor and licensee quoted different totals, the licensee release is used and the divergence is noted in the entry.
Upfront by stage at signature
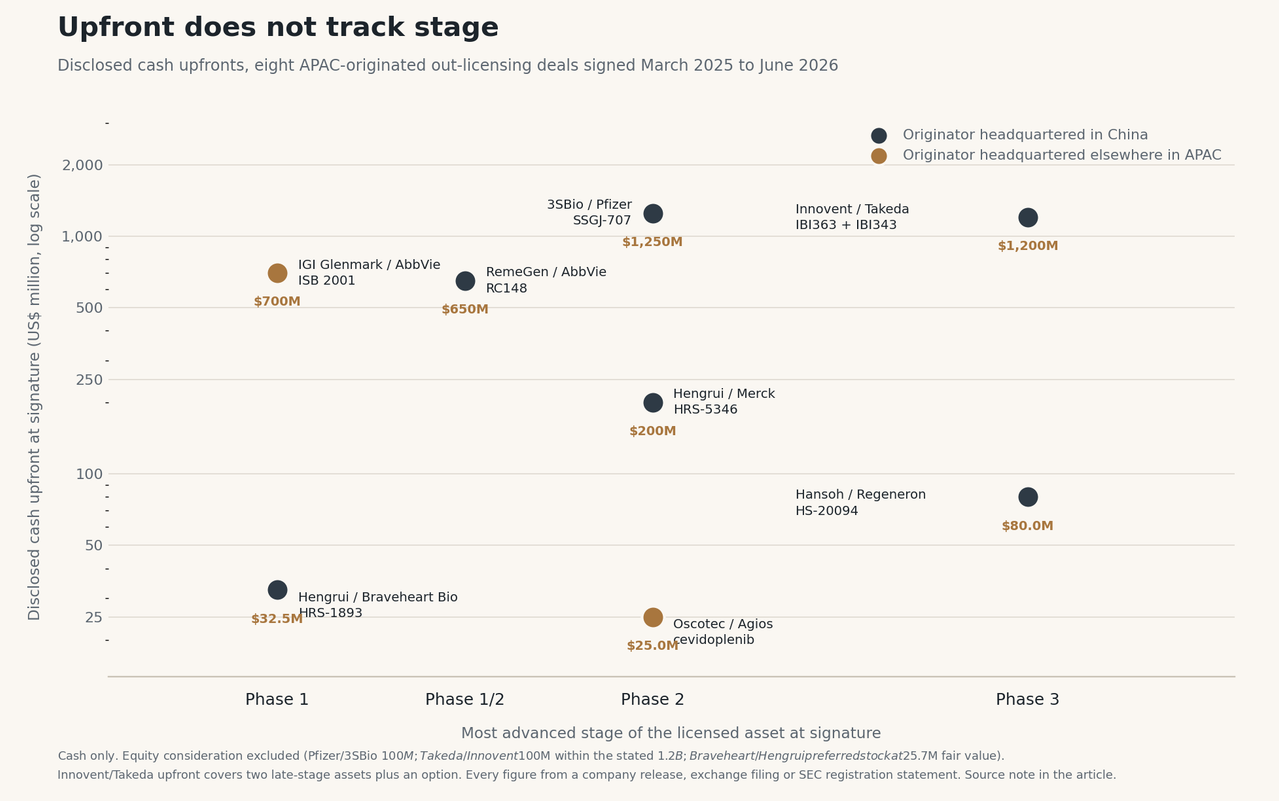
Disclosed cash upfronts only, plotted on a logarithmic scale. Equity consideration is excluded from every point. The Innovent and Takeda point covers two late-stage assets plus an option and is not a single-asset comparable.
What the roster shows
Stage does not set the price. Scarcity does.
Line the eight up by phase and the correlation collapses. The two Phase 1 assets fetched US$32.5 million and US$700 million, a spread of more than twenty to one at identical stage. The two Phase 3 positions fetched US$80 million and US$1.2 billion. The highest single-asset upfront in the set went to a Phase 2 asset.
What separates the top of each pair from the bottom is the competitive density of the target class at the moment of signature. ISB 2001 was a trispecific in a myeloma setting where the approved competition was bispecific. SSGJ-707 and RC148 sat in the same contested bispecific class, the most fought-over of the cycle. HS-20094 sat in the single most crowded category in the industry. Cevidoplenib carried a failed primary endpoint. HRS-1893 was Phase 1 in a mechanism with an established leader already in the market.
For a business development team, the operational reading is uncomfortable but useful. Advancing an asset one phase is expensive and may not move the upfront at all if three competitors advance alongside it. Reaching a differentiated position in a thin field is worth more than reaching a later phase in a thick one.
There is exactly one like-for-like pair, and it is worth more than the other twenty-seven.
Eight entries generate twenty-eight possible pairings. Twenty-seven of them require an argument about whether the two assets are really comparable. One does not.
SSGJ-707 and RC148 are both PD-1 and VEGF bispecific antibodies, both originated in China, both licensed to large US acquirers, eight months apart. Modality, target combination, origin and buyer type are all held constant. What varies is stage and date. The Phase 2 asset went for US$1.25 billion in cash in May 2025. The Phase 1/2 asset went for US$650 million in January 2026.
A business development team benchmarking a PD-1 and VEGF bispecific has, in those two rows, something closer to a genuine market price than anything else in this article. Everything else in the roster is context around it.
The caveat is the obvious one. Two points do not make a curve, and the later deal carried a buyer-specific rationale, combinability with the acquirer’s own ADC portfolio, that the earlier one did not. Use the pair as an anchor, not as a formula.
The upfront share of the headline swings by a factor of twelve.
Expressed as a percentage of maximum contingent value, the upfronts in this roster run from about three per cent to about 36 per cent. The median sits near 11 per cent, broadly consistent with the industry-wide figures published for the period, but the median hides the spread and the spread is the point.
That ratio is the most useful single diagnostic available on any term sheet. A low ratio means the licensee has bought an option cheaply and the licensor is carrying most of its value in contingent form. A high ratio means the licensee has genuinely paid for the asset. Two deals announced at identical headline totals can sit at opposite ends of that scale, and only one of them has de-risked the licensor.
Ex-Greater China is not the only template. There are three.
Five of the eight follow the familiar shape: the licensee takes everything outside Greater China, the originator keeps the home market absolutely, and a royalty runs on sales in the licensed territory.
The Glenmark deal inverts it. AbbVie took Greater China and Japan; the originator kept India, South Korea, Australia, New Zealand, the rest of Asia and the emerging-market band. That is what a carve-out looks like when the licensor’s commercial infrastructure sits across emerging markets rather than in a single large domestic one.
The Oscotec deal does a third thing. It grants global rights outright and retains a repurchase option over the home territory, exercisable after Phase 3.
Two of the eight also carry an option running the other way, giving the licensee a route into the retained market later. Pfizer holds one over China. Takeda holds one over a third Innovent molecule. Territory in this cohort is not a line on a map. It is a set of dated options pointing in both directions, and a meaningful share of the value sits in the options rather than in the grant.
Equity has become standard furniture.
Three of the eight include an equity component, and in each case it does different work. Pfizer’s US$100 million subscription in 3SBio sits alongside the licence fee as a separate instrument. Takeda’s US$100 million sits inside the stated US$1.2 billion upfront and was priced at a premium to market. Braveheart’s preferred stock is consideration for the licence itself, in a vehicle created to hold the asset.
The practical consequence is that upfront is no longer a single comparable figure unless the analyst says what has been included in it. We have separated cash from equity throughout for exactly this reason, and anyone building a model from this table should do the same before comparing anything to anything.
The headline and the filing are different documents.
This roster contains two deals whose widely reported totals cannot be reconciled to the quantified disclosures without doing arithmetic the press release declines to do for you.
The Hengrui and Braveheart transaction was reported at US$75 million in upfront and near-term milestones against a total of up to US$1.1 billion. The SEC filing shows US$32.5 million in cash, US$25.7 million in equity at fair value, US$23.0 million of technology transfer and development milestones, and US$1.0 billion of commercial milestones.
The Oscotec and Agios transaction was reported across Korean media at up to US$665 million. The company release quantifies US$165 million.
Neither is misreporting. Both are the ordinary consequence of a convention in which the licensor’s estimate of full contingent value, including unquantified commercial milestones and royalties, is treated as though it belonged to the same class of number as a disclosed cash payment. The discipline for anyone using this data is simple and rarely observed: compare cash to cash, compare quantified milestone ladders to quantified milestone ladders, and treat everything else as commentary.
What is not in the roster
Three of the period’s largest transactions were considered and excluded, and stating why is part of the method.
AstraZeneca and CSPC Pharmaceutical, announced 30 January 2026, carries a US$1.2 billion upfront, up to US$3.5 billion in development and regulatory milestones and up to US$13.8 billion in sales milestones, for the widely quoted total of up to US$18.5 billion across eight programmes. It is the largest transaction of the period by headline. It fails the roster’s clinical test: the lead asset, SYH2082, was described at announcement as set to enter Phase 1, alongside three preclinical assets and four programmes yet to be created. It is a platform and portfolio deal, not a clinical asset licence, and dropping it into a comparables table for clinical assets would corrupt the table.
ABL Bio and GSK, announced April 2025, licensed a blood-brain-barrier shuttle platform across undisclosed CNS targets for a reported £38.5 million upfront against a total that could reach £2.07 billion. Same exclusion, same reason: platform, not asset.
Deals with undisclosed upfronts were excluded outright rather than estimated. There are several from the period, some of them substantial. An estimate in a comparables table is indistinguishable from a fact once it has been copied twice.
Two absences are more interesting than the exclusions, because they are absences of origin rather than of disclosure.
Japan does not appear in this roster as an originator. It appears as a buyer. Takeda’s US$1.2 billion for Innovent’s assets is the second-largest cash upfront in the set, and Japan also shows up as a licensed territory in the Glenmark deal, sold to a US acquirer. A roster of assets moving out of the region on disclosed terms finds Japanese pharma consistently on the other side of the table.
Australia, Singapore and Southeast Asia do not appear at all. Australian licensing activity across the period was real, but it ran to regional grants, in-region partnerships and smaller specialty transactions rather than global out-licences of clinical assets at disclosed nine-figure terms. That is a finding, and we record it as one rather than padding the roster to make the map look balanced.
Which leaves the composition. Six of the eight originators are headquartered in China. One is Indian. One is Korean. On the evidence of disclosed terms, APAC out-licensing in 2025 and 2026 was substantially a Chinese phenomenon with two significant exceptions, and both exceptions repay study precisely because they are exceptions.
The class of 2027 will not look like this
If the Korean pipeline gap that Seoul’s own industry bodies flagged through 2026 begins to close, if India follows the Glenmark template with a second and a third asset, if Japanese biotechs start appearing on the sell side rather than only the buy side, next year’s roster will read differently. That is a reasonable thing to watch for and an unreasonable thing to predict.
What the 2025 to 2026 class establishes is narrower and more durable. The terms are on the record. The comparables exist. And the gap between what an asset fetched and what the headline said it fetched is now the first thing any business development team should measure, before it measures anything else.
arcilla.fran@biopharmaapac.com
Sources and method
Every financial figure in this roster is drawn from one of four document classes: a company press release issued by the licensor or licensee; an announcement filed with the Hong Kong Stock Exchange or the Indian stock exchanges; a filing made with the United States Securities and Exchange Commission, including Form 6-K, Form DRS and Form S-1; or a law firm transaction notice describing terms its client disclosed. Where the licensor and the licensee published different totals for the same transaction, the licensee release is used as the primary figure and the divergence is recorded in the relevant entry.
Trade press reporting was used to locate transactions and to establish clinical stage, patient numbers and competitive context. It was not used as a source for any financial term. Where a widely circulated figure could not be reconciled to a primary disclosure, the primary disclosure is reported and the discrepancy is stated openly rather than resolved silently.
Currency: all figures are reported in the currency of original disclosure. No conversions have been applied, and readers comparing across entries should note that exchange rates moved materially across the period covered. Percentages of contingent value are calculated as disclosed cash upfront divided by the sum of disclosed cash upfront and maximum quantified milestones; equity is excluded from both numerator and denominator, and unquantified milestone components are excluded from the denominator, which means the true ratios for entries with unquantified components are lower than stated.
This roster covers transactions announced between 1 January 2025 and 30 June 2026. It is not exhaustive. It is a selected set of eight meeting the four stated inclusion tests, chosen to span a range of stages, modalities, deal structures and originator markets. Nothing in the ordering implies ranking.
Disclaimer
Not investment advice. This article is published for information and professional reference only. It does not constitute investment, financial, legal, tax or commercial advice, and nothing in it should be read as a recommendation to buy, sell or hold any security, or to enter into or refrain from any transaction. Readers should obtain independent professional advice before acting on anything set out here.
Terms as disclosed. All deal terms are reported as publicly disclosed by the parties on the dates stated. Licence agreements routinely contain confidential provisions that are never made public, including full milestone schedules, precise royalty tiers, diligence obligations, termination rights and reversion mechanics. The published terms summarised here are therefore partial by definition, and no reader should assume that the disclosed components represent the complete commercial bargain.
Contingent value is not realised value. Maximum deal values quoted in this article are ceilings contingent on the achievement of development, regulatory and commercial milestones. Industry-wide, the substantial majority of such milestones are never achieved. No figure described as a total or maximum should be read as a forecast, an expectation or a probable outcome.
Corporate structure and attribution. Originator attribution in this roster follows the location of the parent entity that consolidates the proceeds and owns the underlying platform or programme. Other reasonable conventions exist, including attribution by the legal domicile of the contracting entity, and would produce a different regional composition for at least one entry. Readers using this material in league tables or benchmarking exercises should state which convention they have adopted.
No relationship with the parties. BioPharma APAC has no commercial relationship with, and received no consideration, briefing, review or approval from, any originator, licensee, adviser or intermediary named in this article. No party was given advance sight of the text. Selection of the eight entries was made solely on the stated editorial criteria.
Currency of information. Deal terms, clinical stages and corporate positions described here are accurate as at the disclosure dates cited and were compiled as at July 2026. Transactions may have been amended, expanded, restructured or terminated since. Clinical programmes may have advanced or failed. Readers should verify current status against the parties’ latest filings before relying on anything set out here.
Corrections. This roster is intended as a durable reference. Where a reader can identify a primary disclosure that contradicts a figure reported here, BioPharma APAC will verify and correct it, and will record the correction in the published version.
Most Read
- Can APAC Biomanufacturing Decarbonise Without Pricing Itself Out?
- The Algorithm on the GMP Floor: AI Promises a Smarter Plant. Regulators Demand the Audit Trail.
- APAC's Peptide-Capacity Gamble
- After the Rush: APAC's mRNA and Vaccine Capacity Hangover
- The Biosimilar Race: Factory to the World — or Stuck in the Copycat Economy?
- The Vein-to-Vein Problem: Can APAC's Cold Chain Carry Advanced Therapies?
- Vectors, Plasmids and the CGT Trap: APAC's Cell and Gene Therapy Ambitions Face an Upstream Bottleneck
- Can APAC Build Radioligand Therapy Before the Atoms Decay?
- The Great Biopharma Reset: 50 Developments That Changed Everything in H1 2026
- Beyond the Trial: Can Real-World Evidence Earn Regulatory Trust in APAC?
- Beyond the Obvious Giant: Where APAC's Clinical Trials Go Next
- The Frontier That Won’t Quite Arrive
Bio Jobs
- Sanofi Turns The Page As Belén Garijo Steps In And Paul Hudson Steps Out
- Global Survey Reveals Nearly 40% of Employees Facing Fertility Challenges Consider Leaving Their Jobs
- BioMed X and AbbVie Begin Global Search for Bold Neuroscience Talent To Decode the Biology of Anhedonia
- Thermo Fisher Expands Bengaluru R&D Centre to Advance Antibody Innovation and Strengthen India’s Life Sciences Ecosystem
- Accord Plasma (Intas Group) Acquires Prothya Biosolutions to Expand Global Plasma Capabilities
- ACG Announces $200 Million Investment to Establish First U.S. Capsule Manufacturing Facility in Atlanta
- AstraZeneca Invests $4.5 Billion to Build Advanced Manufacturing Facility in Virginia, Expanding U.S. Medicine Production
News